☕ Coffee Shop Sales Analysis – SQL + Power BI
This project analyzes the daily and product-level performance of a coffee shop using Power BI and SQL. The analysis uncovers trends in sales, top-performing products, and customer behavior, providing actionable business insights.
📌 Project Objective
- Track revenue growth and daily performance
- Identify top-selling products and categories
- Analyze product-wise profit and quantity sold
- Support inventory and business decisions
🔧 Tools & Technologies Used
- SQL Server / MySQL
- Power BI
- Excel
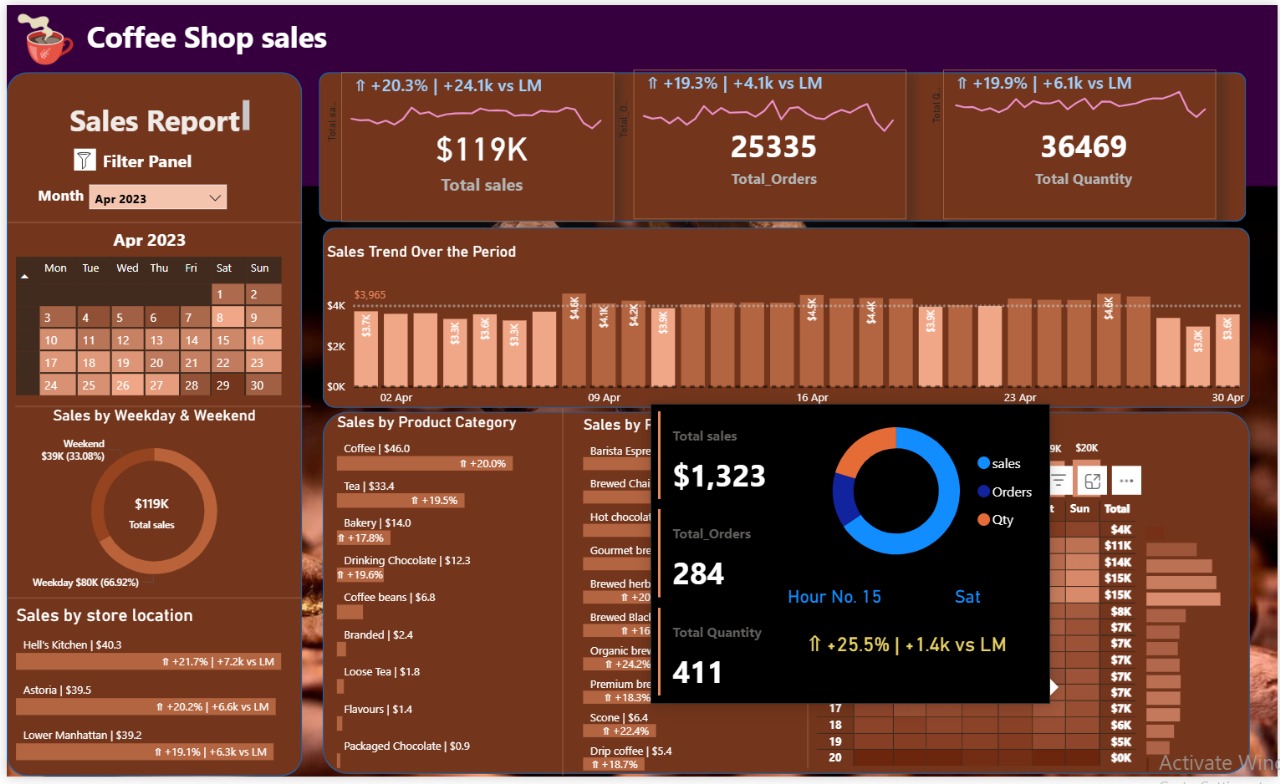
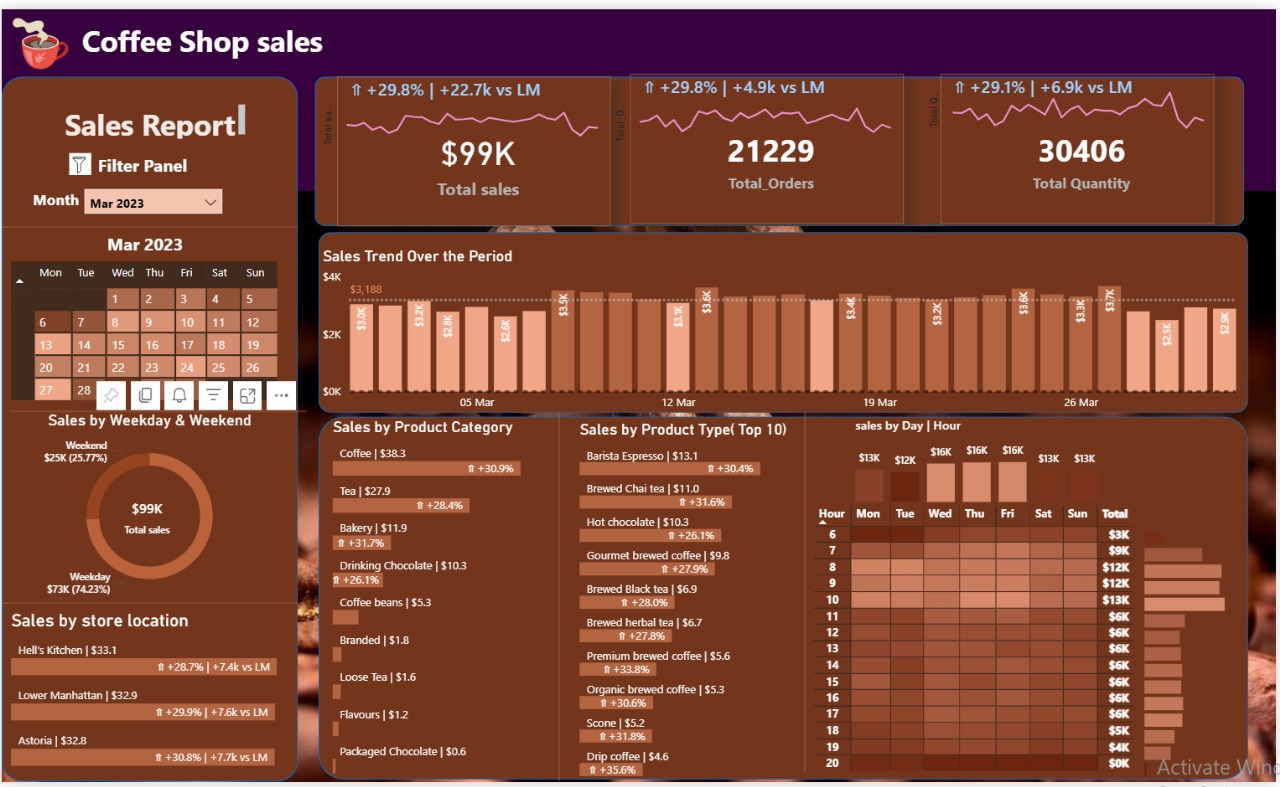
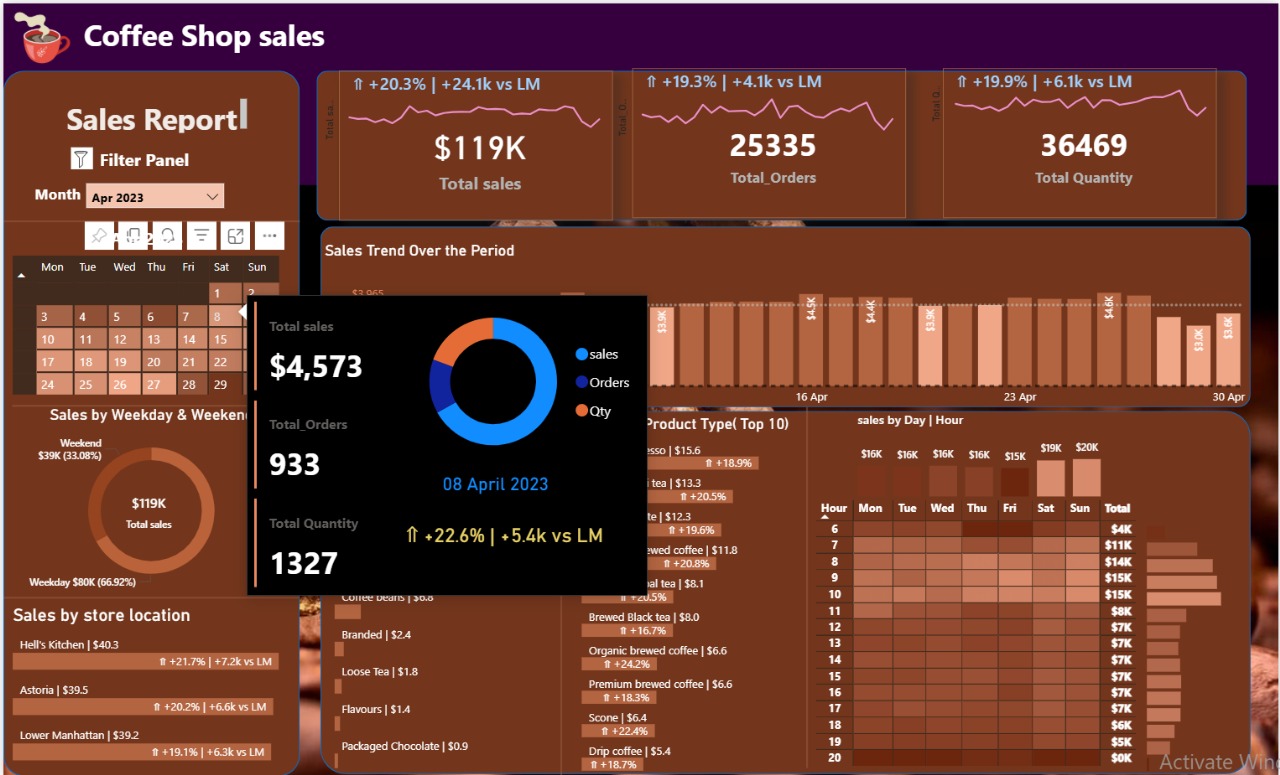
📊 Dashboard Preview
 🔗 View Dashboard (Power BI Access Required)
📈 Key KPIs
- Total Revenue – SUM of sales per product
- Quantity Sold – Total quantity sold across days
- Gross Profit – Revenue minus cost
- Top Product by Sales, Profit, Quantity
-- Total Revenue
SELECT SUM(Sales) AS Total_Revenue FROM coffee_shop;

-- Total Quantity
SELECT SUM(Quantity) AS Total_Quantity FROM coffee_shop;

-- Gross Profit
SELECT SUM(Profit) AS Total_Profit FROM coffee_shop;

-- Top Products
SELECT TOP 5 Product, SUM(Sales) AS Total_Sales
FROM coffee_shop
GROUP BY Product
ORDER BY Total_Sales DESC;
📊 Dashboard Features
- Daily Sales and Quantity by Date
- Profit Trend by Product and Category
- Top 5 & Bottom 5 Products (Sales, Quantity, Profit)
- Interactive Category-Level Filters
💡 Business Insights
- Seasonal spikes visible during weekends
- Pastries and Lattes have highest profit margins
- Daily sales average around $1,000
- Top 3 products contribute 40%+ of total revenue
📬 Contact
- Name: Nikhil Chavan
- Email: nikhilcaptain4@gmail.com
- LinkedIn: linkedin.com/in/nikhil-c